Performance benchmark

The performance of video games is crucial for the overall gaming experience and smooth gameplay. Fast performance ensures that players can fully immerse themselves in the virtual world, further enhancing engagement with the game. UI performance varies greatly and it depends on the UI implementation and the complexity of the UI itself. The top bar for well-optimized UI is around 1.6ms for an entire cycle of our plugin to receive the information and render it on the screen.
Generally, for the game to work smoothly, it is required to render 60 frames per second, which on average is 16.67 milliseconds to complete each frame. We at Coherent Labs strive to have the best-performing technology for UI creation and have hence optimized many of the slow paths of HTML rendering. Our mission is for the UI to take no more than 10% of the required time to render a frame, hence the 1.6 milliseconds target.
To get a more detailed representation of the performance benefits our solution offers, let’s pick two technologies that have similar capabilities and put them to test against our tech
- A browser such as Google Chrome which uses the Chromium HTML engine, whereas Gameface uses the optimized HTML engine (we refer to it as CoHTML).
- An engine UI system such as the UMG one in Unreal Engine
For the test to be identical, we will be using the same resources in both environments. Let’s now dwell on the two cases we picked and share our results.
Benchmark with browser:
For this benchmark test, we will use an HTML page(which can also be downloaded from this link) to spawn numerous damage indicators, as in any hack’n’slash games. The scenario that we will follow both in the browser(Google Chrome) and Gameface’s Player would be:
- Firing rate = 2
- Targets number = 1000
Browsers score 5 frames per second on average:

Gameface score 22 frames per second on average:

Comparison with UMG:
To have a better comparison against a UI technology, namely Unreal Motion Graphics, we’ve implemented the same UI with both Gameface and UMG and profiled it.
The UI test case we have made consists of the following:
HUD screen:
- Minimap
- Healthbar
- Enemy nameplates
- Radial weapon menu
- Weapon stats bar
- Inventory
Unreal Engine UMG HUD video showcase - https://youtu.be/VK9QXho9qa8
Gameface HUD video showcase - https://youtu.be/29b9nF6OXQ0
Main menu:
- Loading screen
- Login form
- Settings
- Main menu screen
Unreal Engine UMG Menu video showcase - https://youtu.be/0Iy-pB5Bw0k
Gameface Menu video showcase - https://youtu.be/9QkAxCU9lA8
Gameface vs. UMG results
Considering the results depend on the hardware on which the game is played, we have used a Windows machine with the following specifications:
- Intel i7 6700K
- Nvidia GTX 1080
- 32 GB RAM
- Game Resolution: 1920x1080
Profile markers:
The markers you will see in the performance measurements below are split for the UMG's Slate systems and the Gameface ones:
- UMG markers:
- Slate
- TotalSlateTickTime - Game Thread
- SlateRT: Rendering - Render Thread
- Gameface markers:
- Plugin-specific markers:
- JavaScript Events - Game Thread
- Data binding model synchronization - Game Thread
- View::Advance - Game Thread
- System::Advance - Game Thread
- ViewRenderer::Paint - Render Thread
- TotalCPU - All of the above categories
- Task Graph markers:
- FCohtmlLayoutTask - Worker Thread
- FCohtmlResourceTask - Worker Thread
Test scenario
To make the same test, we followed the next scenario:
- Open the Main Menu and go over the same settings in UMG and Gameface
- For the HUD screen:
- Weapon stats bar
- Shoot x 30
- Overheat the weapon
- Control health bar
- Lose all health and then heal again
- Change weapons
- Open the radial menu and move the mouse
- Inventory
- Drag and drop an element
- Minimap and nameplates
- Data is from 3 enemies
Performance captures numbers
UMG:
- UMG Main Menu markers

- UMG HUD screen markers

Gameface:
- Gameface Main Menu markers

- Gameface HUD markers

Summary
The proprietary HTML engine(Cohtml) and renderer(Renoir), the time required to complete a frame in Gameface is drastically reduced compared to the browsers when rendering heavy pages. Taking performance captures using Google Chrome Dev tools we can see that for the specific case we see 10 times better results on the main thread for our solution:
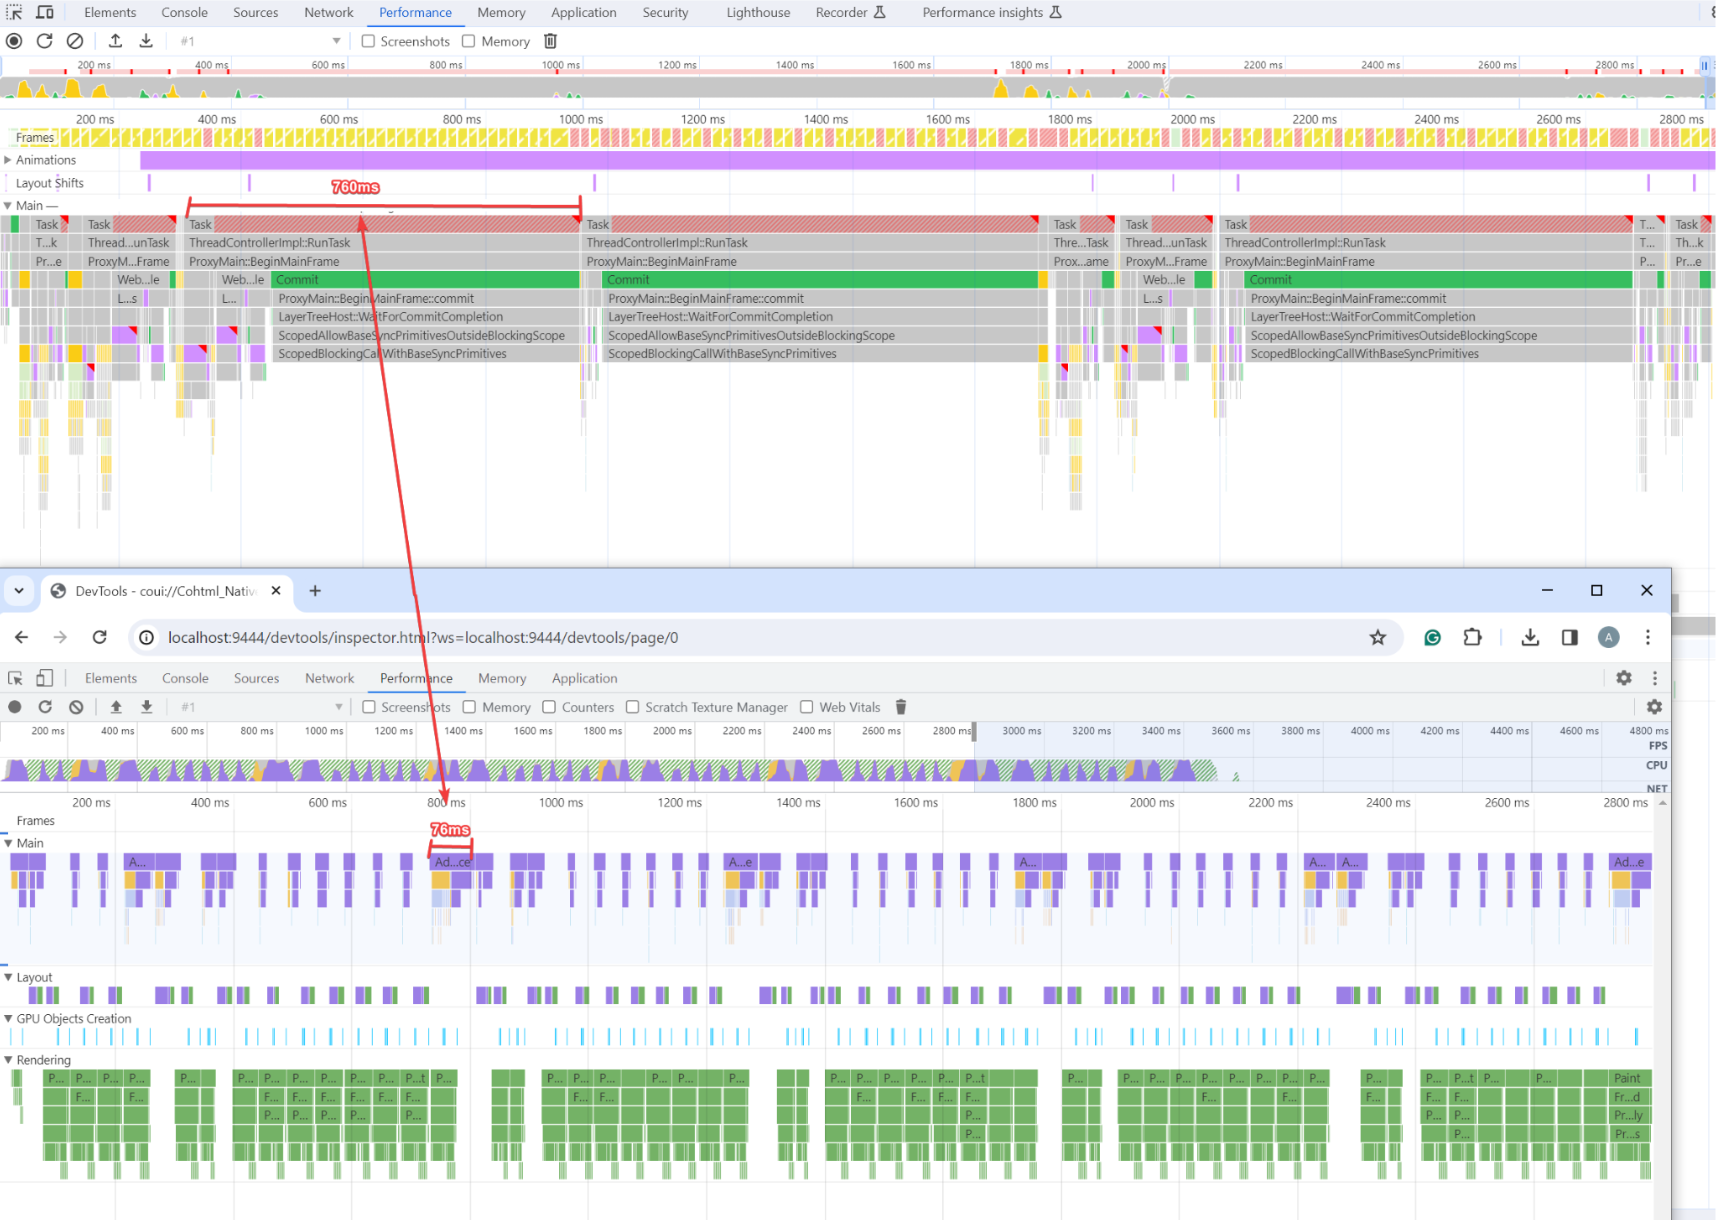
The performance comparison with Unreal Engine’s UMG UI system, we also see three times better performance for the main menu UI where occasionally animations are triggered and around 10% better performance for dynamic UIs where updates are made each frame. In the HUD screen, constant communication is made between the C++ code and the UI code(UMG for Unreal Engine and HTML/JS for Gameface) which adds the performance overhead in both scenarios.
We have covered the performance as one of the Gameface pillars but there is much more to it that distinguishes it from other UI solutions. The iteration speeds while making the UI, the UI memory footprint on the game, the intuitive web-centric workflow, and finally the tremendous resources online on how to make game UI with web technologies makes the use of Gameface a breeze. Stay tuned for more posts of this kind where we will cover the other aspects of game UI in more detail.🙂
Please sign in to leave a comment.
Comments
0 comments