Debugging the UI using the Google Chrome dev tools

Gameface supports the Google Chrome Dev protocol and allows for live viewing, editing, and debugging of the UI, even when the client application is running. This allows UI programmers and designers to directly work on the live interface without stopping the game, recompiling, or restarting. In this post, we will look at the different panels and their usage.
The Gameface Dev Tools look identical to the Chrome Dev Tools, but with limited functionality. To open them you can either press F12 in the Player, or go to http://localhost:9444/ in the browser of choice.

Note that If you don’t have a running instance of the UI, you won’t be able to connect to the Dev Tools. You also won’t be able to open multiple tabs in your browser, so in case you encounter the following error, it is most likely due to the reasons mentioned above:

Once you navigate to http://127.0.0.1:9444 you will see all inspectable HTML pages that are currently running. Clicking to inspect them will open the Google Chrome dev tools.
The Google Chrome dev tools’ navigation bar consists of seven tabs by default. You can add more tools from the three vertical dots on the right top side, such as the Rendering settings or the JavaScript Profiler:

Now let’s take a look at the main tabs used for debugging the UI.
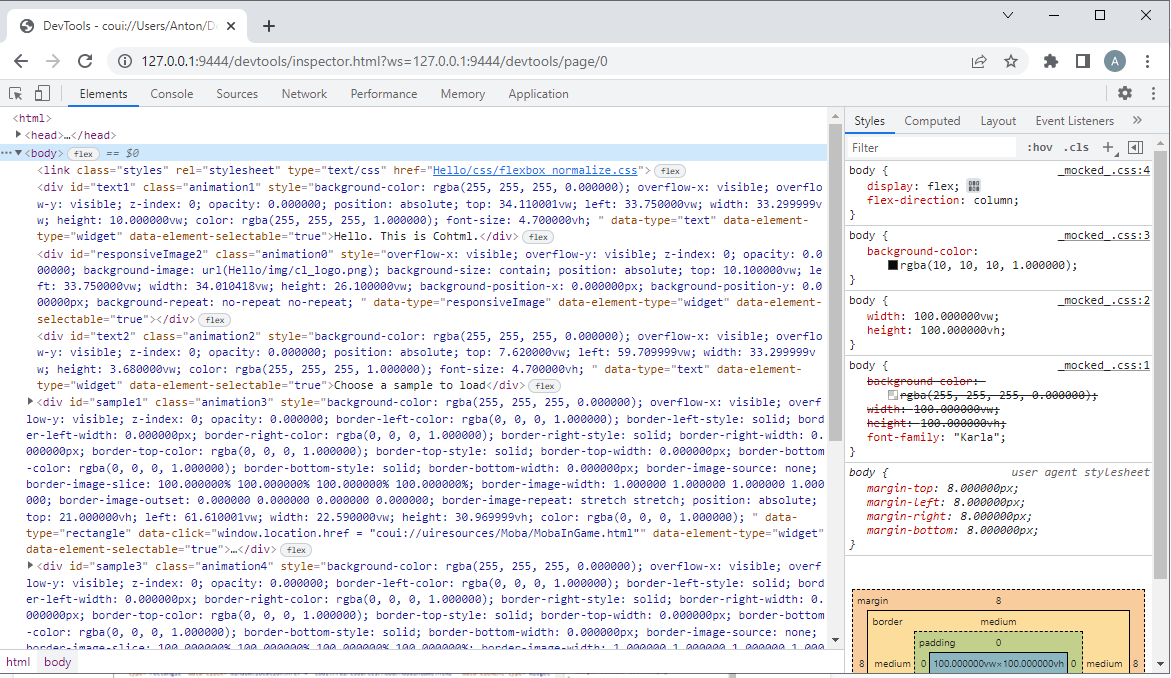
Elements
The loaded HTML page with all its DOM elements are shown. You can hover over elements and they will be highlighted in the scene. On the right side of the Debugger, there is a menu that allows you to inspect the DOM nodes and the CSS styles (you can filter the computed styles, the rules or the visual styles). All properties of the elements are editable and changes will be immediately visualized in the live application.
From the Elements tab, you can use the Inspect element tool(Ctrl + Shift + C) to select an element in the UI (it will be highlighted in the Elements tab where it is defined):

Console
The Console tab provides two primary functions for developers testing their code. It is a place to log diagnostic information in the development process (provided by the Console API) or a shell prompt which can be used to interact with the document.

In instances where a message is consecutively repeated, the Console “stacks” the messages and shows a number in the left margin ( rather than printing out each instance of the message on a new line). The number indicates how many times the message was repeated.

Sources
This tab allows you to inspect resources that are loaded in the inspected page. You can organize resources by stylesheets, scripts, images, or other criteria.

On the right side, you would be able to view the content of the file. Please note you will not be able to make changes inside these files, but you can use breakpoints for debugging.
A common method for debugging a problem is to insert multiple console.log() statements into the code in order to inspect values as the script executes.
The console.log() method may get the job done, but breakpoints can get it done faster. A breakpoint lets you pause your code in the middle of its execution and examine all values at that moment in time. Breakpoints have a few advantages over the console.log() method:
- With console.log() you need to manually open the source code, find the relevant code, insert the console.log() statements, and then reload the page in order to see the messages in the Console. With breakpoints, you can pause on the relevant code without even knowing how the code is structured.
- In your console.log() statements, you need to explicitly specify each value that you want to inspect. With breakpoints, DevTools shows you the values of all variables at that moment in time (sometimes there might be variables affecting your code that you’re not even aware of).
Adding breakpoints can be done by simply pressing the number of the line next to the code you want to debug:

If the line has object values, you can break the execution at that specific value.
Next, you only have to refresh your UI and the code will “break” or pause the execution at the breakpoint we created. We can now hover over the code and get the values that are set for the exact time the code is paused:

To resume the script execution you can click on the play button in the right panel:

If you have other breakpoints after the resume, the code execution will also pause on them as well.
If you’d like to go step by step through the execution of the code, you can press the button next to the resume one and it will take you to the next line of code that should execute.
Network
Here you can measure the network performance. This tab records information about each network operation, including detailed timing data, HTTP request and response headers, and more.

Performance
The Performance tab helps you check the page performance. You can use the Performance tab to record and analyze every event that occurred after a page load or a user interaction.

Here we can create recordings of our performance and then analyze them. To start a recording, press the record button (or CTRL + E) and in the Player, start using your UI (for example, press button, trigger events, etc). Once completed, you can press the stop button and you will get a timeline of the JS code that was executed, together with information on how long it took.

Here we can see that there is a large execution in our UI at the 14-second mark.
We can now use the mouse wheel to zoom in and view it in more detail:

Here we are able to see that the Advance takes the most time - this is the function in the backend that advances the internal timer of the View and runs all animations. If any changes have happened in the page, this call will also trigger a new layout and render on the other threads. The Advance includes all of the JS code executions, animations, hit testing of the mouse, layout recalculations caused by animations or style change from the JS, layout and DOM tree synchronization, etc.
In most cases, a long advance call indicates that there are probably long executions in the JS code. To see them in more detail, you can download the profile you have generated by using the Save Profile button.
In Chrome, you can load the profile you have saved and you’ll observe the following JS function executions:

Memory Tab
In addition, we can use the Memory tab to check the memory consumption of our Front End. It provides information about how a page is using memory. After opening the Memory tab, you are introduced with three options to investigate your UI’s memory usage: you can take a heap snapshot, start allocation instrumentation on a timeline, or begin allocation sampling.

Currently, Heap Snapshots and Allocation Profiles are supported in Gameface.
The quickest option you have is taking a heap snapshot. Once a snapshot is loaded, you can further inspect the memory distribution of the JavaScript objects and DOM nodes (at the time when the snapshot was taken).

Now, under the name of the snapshot, we have the overall size of the JavaScript objects that can be reached.
After selecting the loaded snapshot, you can see a table with the constructors and objects deriving from them (grouped by size, distance, and the number of objects retained).
Here is a short overview of the columns in this table:
- Constructor: the JavaScript function used to construct the objects.
- Distance: Distance from the root. The greater the distance, the longer the object takes to load and process.
- Objects Count: the number of objects created by the specified constructor.
- Shallow Size: the shadow size of every object that was created via a particular constructor.
- Retained Size: the greatest retained size of a set of objects.
However, this is only for the Summary view. You also have the options for the Comparison, Containment and Statistics views.

The comparison view allows you to find differences between the snapshots you have taken. You can access this option if you have taken more than one snapshot.
By default, it will compare the current snapshot to the previous one and display the detected differences in the table. However, you can select a particular snapshot you want to compare as well.

Here is a short overview of the table columns in the Comparison view:
- Constructor: the JavaScript function used to construct a set of objects.
- #New: how many new objects have been created.
- #Deleted: how many objects have been deleted.
- #Delta: the change in the overall number of objects.
- Alloc. Size: how much memory has been allocated to be used.
- Freed Size: how much memory has been freed for new objects.
- Size Delta: the change in the overall amount of free memory.
The other views - Containment and Statistics, will display the information from the Summary, but with color-coding or charts.
Please sign in to leave a comment.
Comments
0 comments